Checkout our work

Parkar


Back
Back
Back
Winners don’t make decisions based on guesses. They make moves based on data.
Before you make the big play, you test the waters. That’s the essence of A/B testing.
Think of it as running a split-screen for two football games. One has all the action - fast plays, smart moves, crowd roaring. The other? Slow, disjointed, not much happening.
Which one do you keep watching?
That’s exactly how your ICP (ideal customer profile) behaves on your website.
At its core, A/B testing is a way to compare two (or more) versions of a webpage that performs better for a specific goal, like:
A/B testing lets you run that same split-screen in real time with your live traffic. You show two versions of a page, maybe one with a direct CTA, the other with a narrative-led scroll.
Whichever version gets more “Book a Demo” clicks, longer session time, or higher sign-ups… that’s your winning game.
That’s what stays.
No more betting on opinions. You let the audience pick the MVP.
A/B testing is more than optimization - it’s market validation in real time.
In early GTM stages, you don’t have months to wait.
You need to ship, learn, and adapt. Fast.
A/B testing lets you:
In legacy systems, even small tests meant dev tickets, release schedules, and testing delays.
But with Webflow? Marketers have control.
You can duplicate pages, tweak designs, and connect with tools like Google Optimize or Optimizely without writing a single line of code.
On PARKAR’s website, we ran a test on how we introduced their brand narrative. One version leaned into innovation-led messaging, the other emphasized credibility and delivery.


The result wasn’t just higher engagement - it clarified how the audience wanted to be spoken to.
Before you test anything, get clarity on what you want to improve.
Choose one specific element to change between Version A and B.
Examples:
When we partnered with Parkar, their homepage was doing too much - trying to sell ten different capabilities all at once. It diluted their message and overwhelmed visitors.
So we ran an A/B test.
Version A was the original: a wide, cluttered mix of services and offerings.
Version B stripped it down to just the two things Parkar excels at:
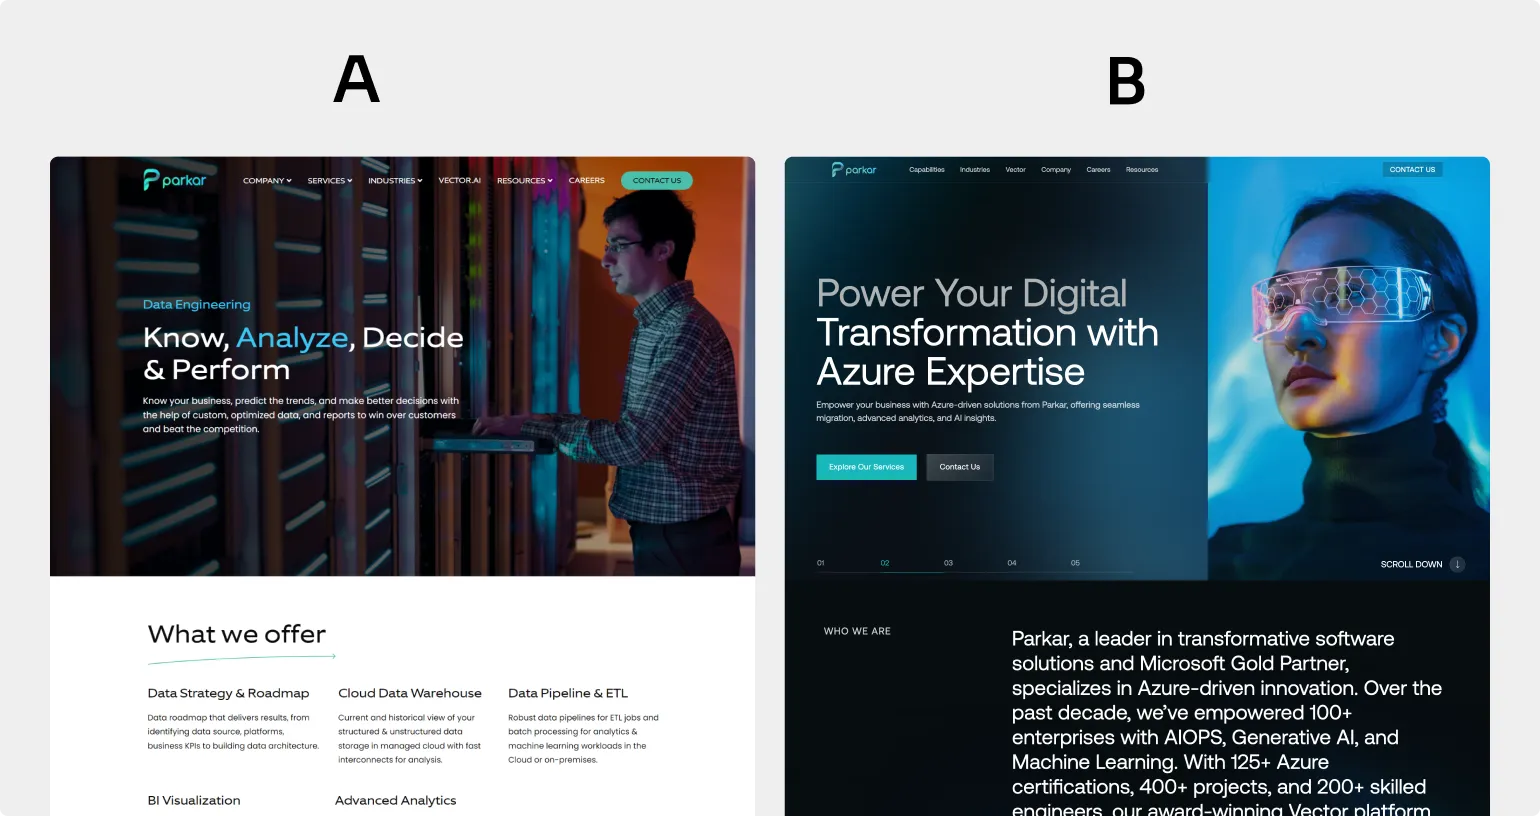
We rewrote the copy, restructured the narrative, and simplified the hero layout.
The results? Visitors stayed longer, clicked deeper, and most importantly - understood exactly what Parkar stood for.
Since Webflow doesn’t have native A/B testing, you’ll need to create two versions:
Make your changes to the duplicated version only.
If Using Google Optimize (Free Tool from Google):
/home) as the base/home-variant)Set how much traffic goes to each version (usually 50/50 for clean comparison)
Once set up, publish the changes in Webflow and start the experiment in Optimize.
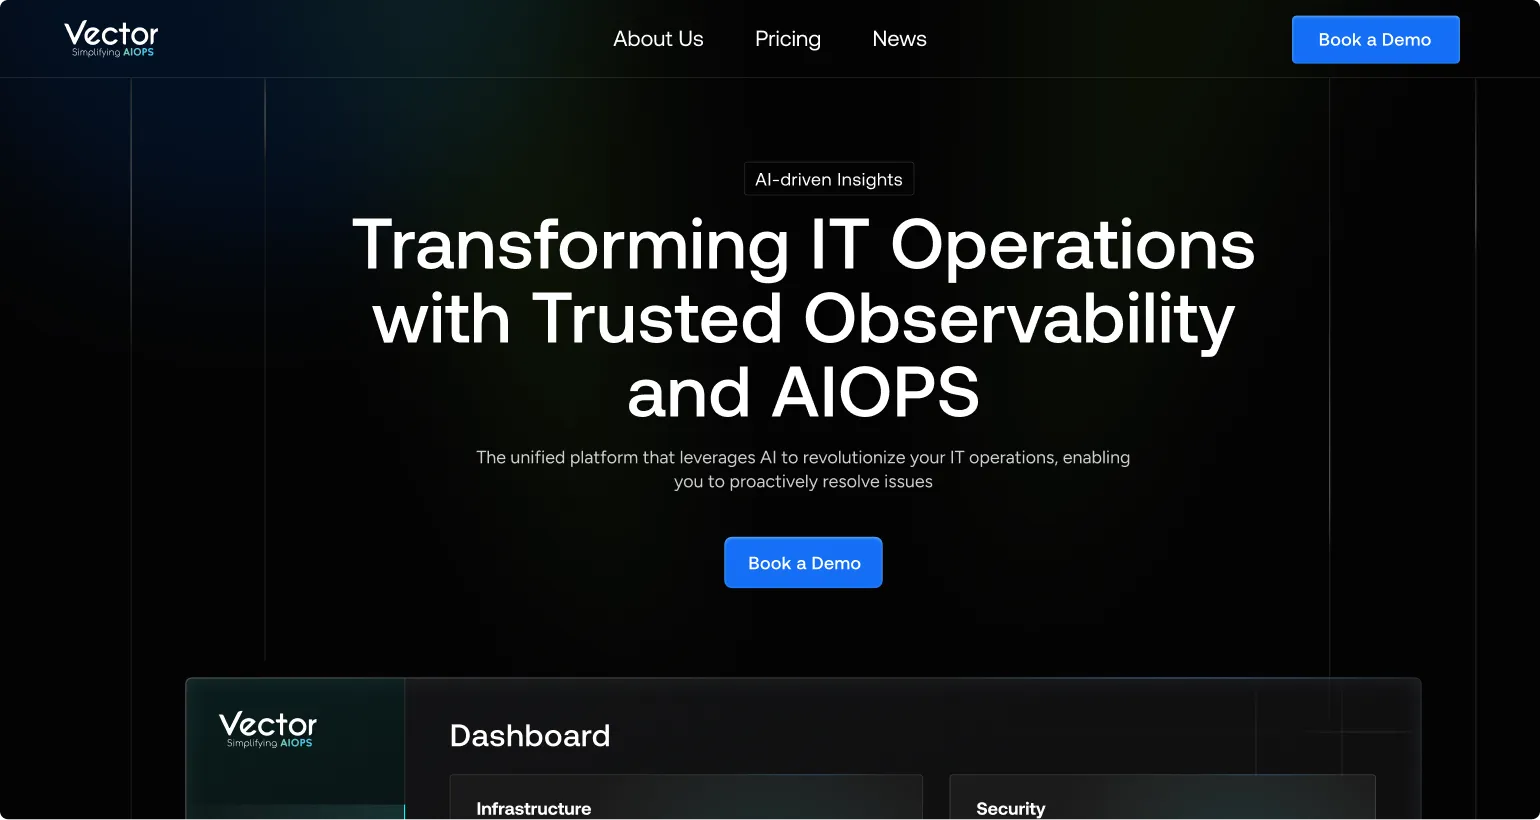
We also ran a second A/B experiment with Parkar for their award-winning product, Vector.
The question
Should Vector have its own standalone website, or should it live as a product page within the main Parkar site?\
To find out, we built two separate experiences, a full microsite for Vector and an integrated product page within Parkar’s main site. We ran both versions in parallel for a month, tracking traffic, engagement, and conversions.

The result?
The integrated version performed significantly better. Visitors preferred staying in one ecosystem. It reduced context-switching, improved trust, and helped users connect the product to Parkar’s broader platform-led services.
Let the test run for a statistically significant time (usually 2–4 weeks depending on traffic).
Don’t stop early unless one version is clearly underperforming.
Focus on key metrics only (don’t get distracted by vanity metrics).
Once your test concludes:
Another example is the work we did with TeamOhana.
From headline to visual language, everything was tested - not once, but multiple times.


These changes weren’t made on instinct. They were backed by data.
As a result, the updated version of the site delivered an immersive experience.
Visitors not only stayed longer - they explored more pages, connected more deeply, and walked away with a clear understanding of TeamOhana’s value.
A/B testing is more than optimization - it’s market validation in real time.
In early GTM stages, you don’t have months to wait.
You need to ship, learn, and adapt. Fast.
A/B testing helps you:

The journey’s just as exciting as the destination. So, what are you waiting for? Let’s hit the gas.